
Summary
In this article, I describe the findings from my elevation gain tests with the Stryd Duo, version 4.0 model 27. This is an initial exploration, based on 2 activities. I compare the results with accurate elevation maps.
- The elevation gains reported in Stryd PowerCenter are 16% and 21% too low and are not clearly reproducible.
- The Stryd pods themselves deviate by about 25% on the low side.
Unlike horizontal distance, the Stryd pods therefore do not seem usable for measuring elevation gain.
What did I test?
To specifically get some elevation gain, I went a few times to the stairs in the Kwintelooijen nature reserve, among other places. The nice thing about this location is that it goes straight up and then straight back down, without any descent in between. That makes it easy to use as a reference point for the reliability of the elevation gain measurements: you simply take the difference between the highest and lowest point.
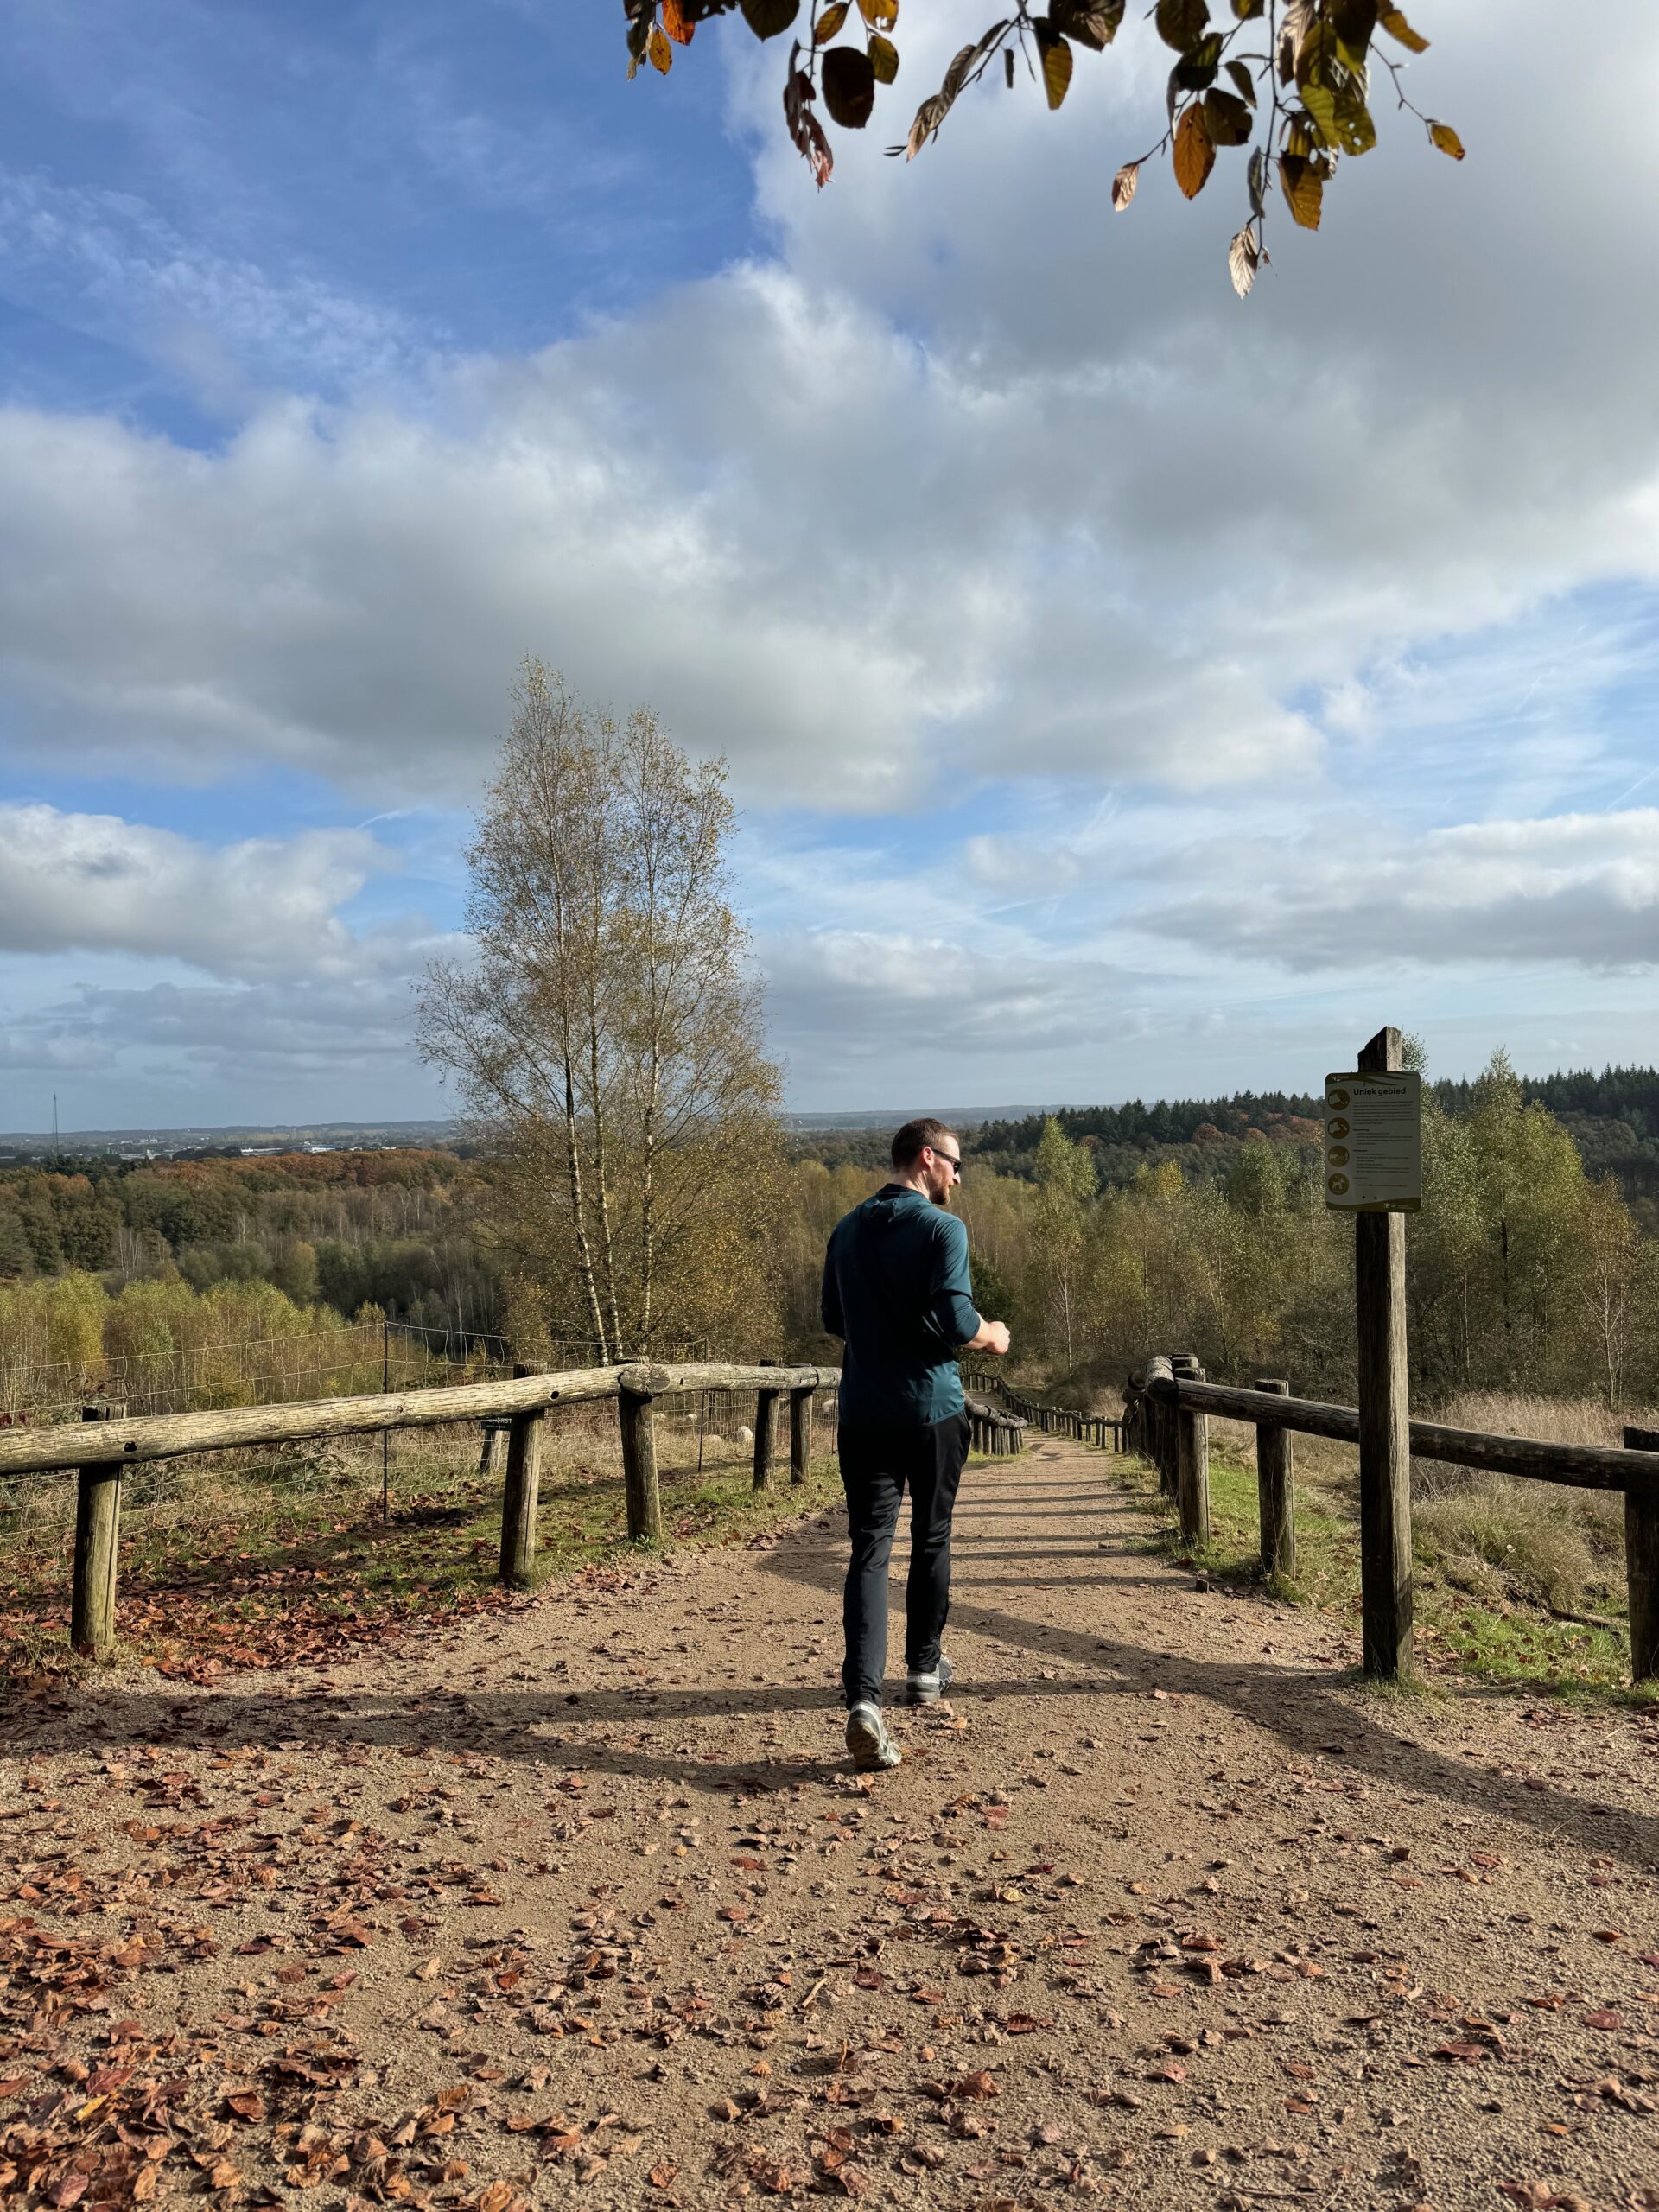
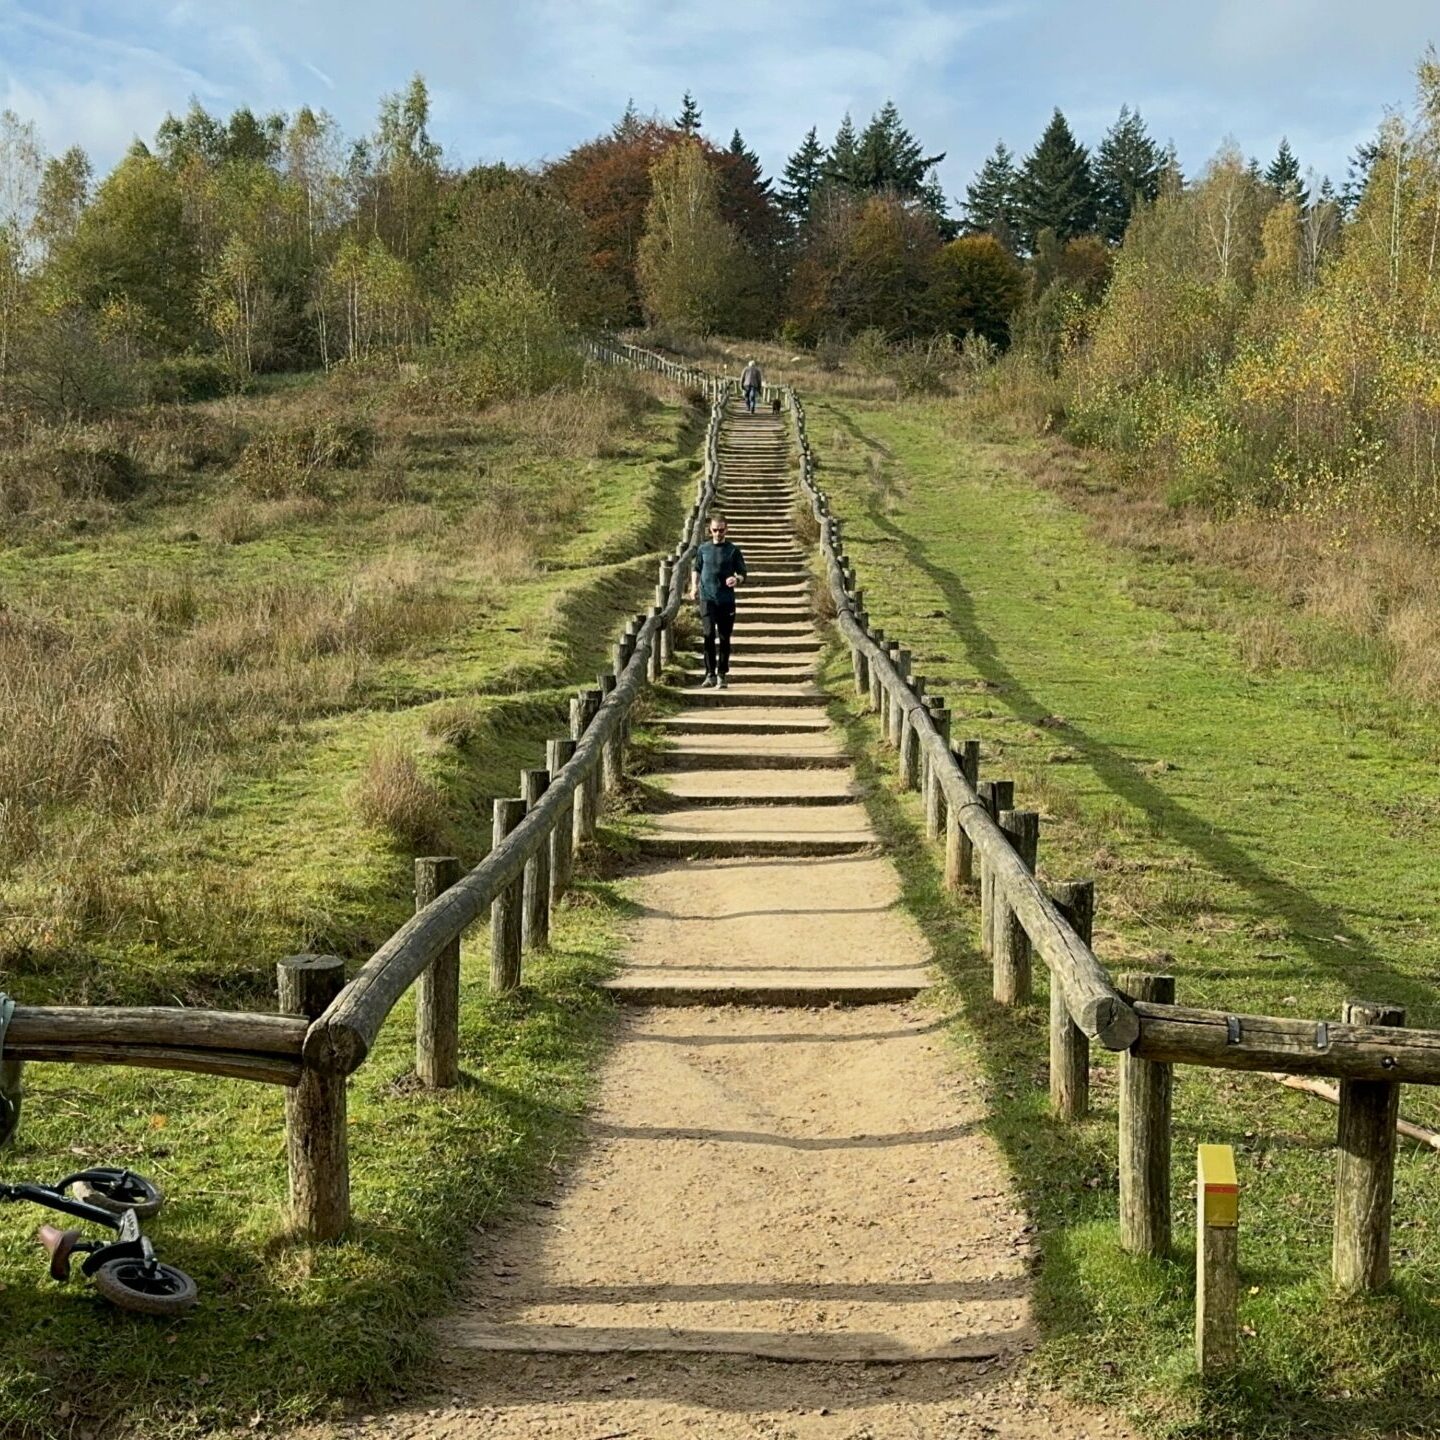
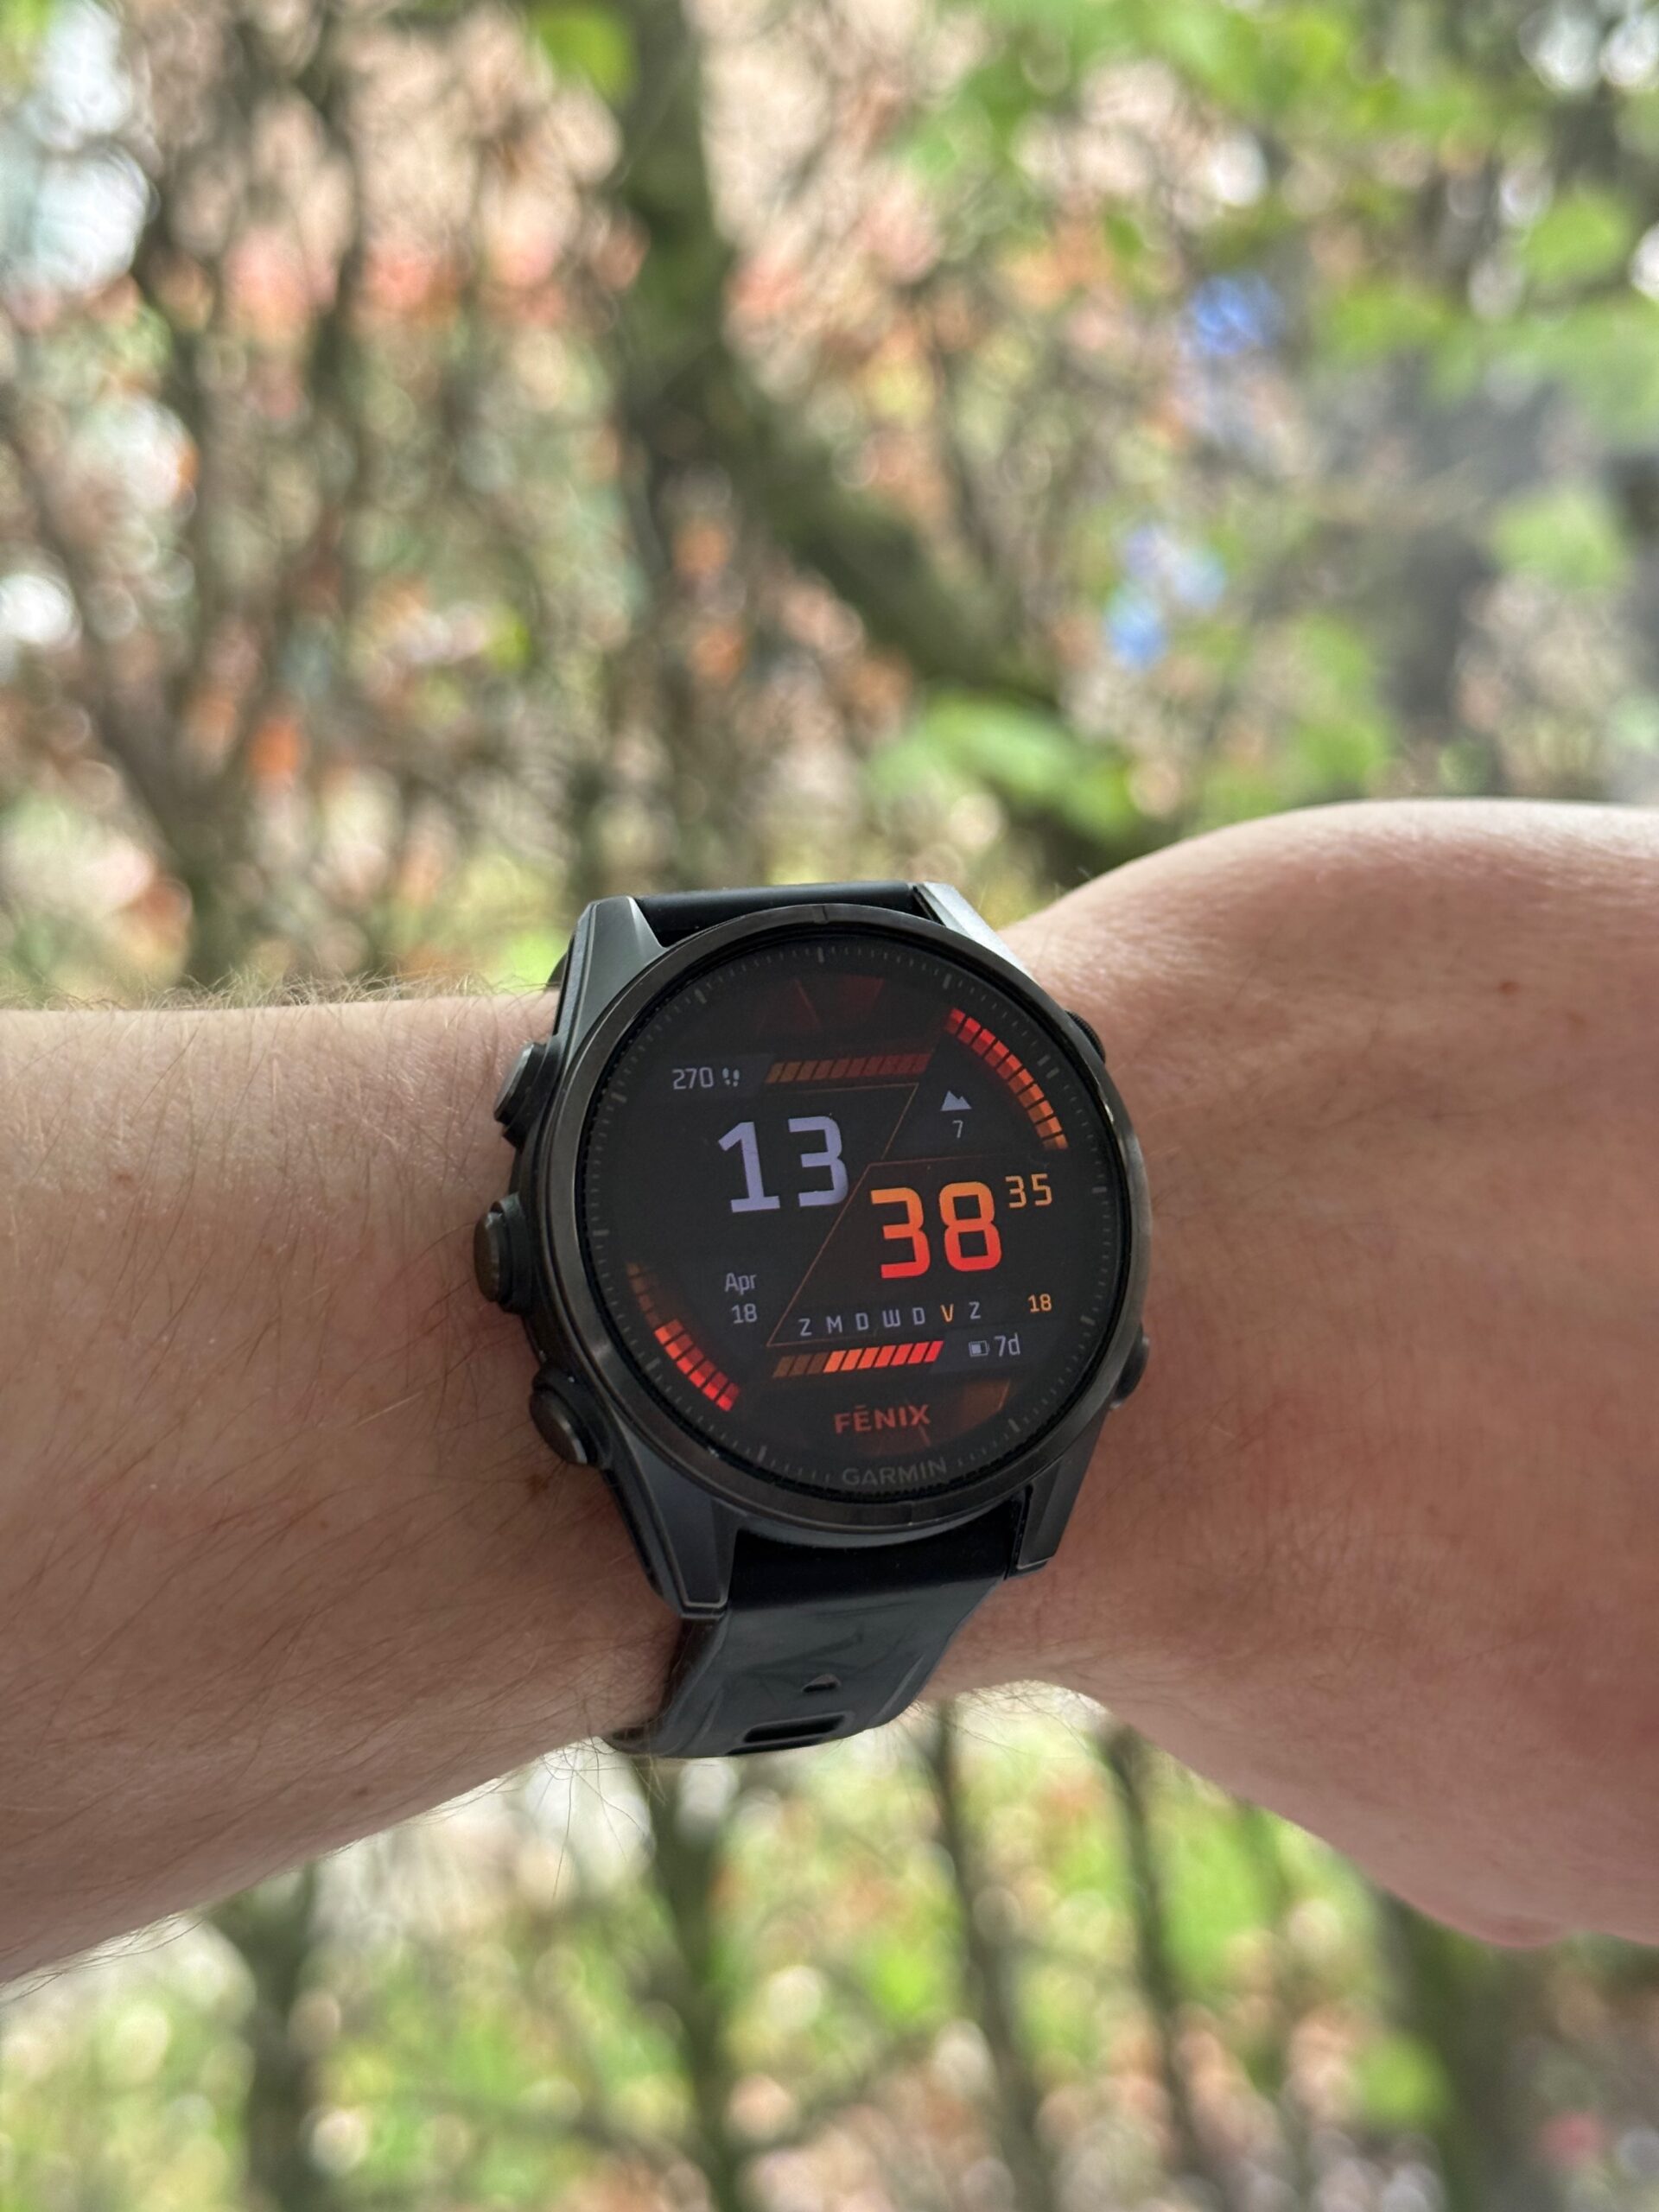
I wear a Garmin Fenix 8 (43 mm) AMOLED watch, with the Stryd Duo footpods connected to it. I then have my activities sync from Garmin to Strava and Stryd. If I put the elevation data from Garmin, Strava, and Stryd into a table, I get the following results. On February 15, my goal was to gain 1,000 metres of elevation; on April 13, the goal was to run at least 2,000 metres of elevation gain.
| February 15 2025 | April 13 2025 | |
|---|---|---|
| Garmin fenix 8 software | Version 12.38 | Version 13.35 |
| Number of stair climb repetitions | 30 x | 59 x |
| Elevation gain according to Garmin | 1,049 meters | 2,071 meters |
| Elevation gain according to Strava | 1,049 meters | 2,071 meters |
| Elevation gain according to Stryd | 870 meters | 1,823 meters |
In other words, according to Stryd I did not actually cover the vertical distance I thought I had, based on my watch! So which one is right?


Fortunately, in the Netherlands we have a very accurate DTM (Digital Terrain Model, representing ground elevation) in the form of AHN (Actueel Hoogtebestand Nederland). At the time of writing, AHN version 5 is being produced, but it is not yet available for Kwintelooijen, so AHN4 is the most recent and most accurate elevation data currently available. According to the quality description, 99.7% of the points are within 20 cm of the actual elevation. If I plot these stairs on it, I get the following: see this link https://viewer.ahn.nl/AHN4/DTM/….

This gives an elevation difference of 50.88 – 13.90 = 36.98 metres. If we apply AHN’s stated 99.7% accuracy limit of 20 cm to both measurement points, the calculated elevation difference could be off by up to 40 cm in the worst case. Based on AHN4, the elevation difference is therefore likely to be between 36.58 and 37.38 metres. With this data, we can add further details to the table.
| February 15 2025 | April 13 2025 | |
|---|---|---|
| Number of stair climb repetitions | 30 x | 59 x |
| Elevation gain according to Garmin | 1,049 meters | 2,071 meters |
| Elevation gain according to Strava | 1,049 meters | 2,071 meters |
| Elevation gain according to Stryd | 870 meters | 1,823 meters |
| Elevation gain according to AHN4 | Between 1,097.4 and 1,121.4 metres | Between 2,158.22 and 2,205.42 metres |
| Garmin deviation from AHN4 midpoint | -60.4 metres / -5.4% | -110.82 metres / -5.1% |
| Stryd deviation from AHN4 midpoint | -239.4 metres / -21.6% | -358.82 metres / -16.4% |
Conclusion: in these 2 cases, Stryd deviates 3 to 4 times more from the AHN4 reference than Garmin does!
To be honest, it is not clear to me whether Stryd relies only on GPS data and applies an incorrect correction algorithm to it, or whether it actually uses the pods to calculate elevation data. It is worth mentioning, though, that the horizontal distance shown by Garmin, Strava, and Stryd is almost identical.
| February 15 2025 | April 13 2025 | |
|---|---|---|
| Number of stair climb repetitions | 30 x | 59 x |
| Distance according to Garmin | 12.51 km | 25.07 km |
| Distance according to Strava | 12.50 km | 25.07 km |
| Distance according to Stryd | 12.50 km | 25.07 km |
I asked Stryd why such a large difference in elevation gain can occur. There is a Stryd article on this topic, but it does not really say that much. They refer to an interesting article from gpsvisualizer.com, only to then say that they do not use those methods.
With 2 activities from 1 user at 1 location, I understand that this cannot cover all cases of an algorithm. More data and broader research would be needed for that. On the other hand, you need exactly a collection of concrete cases like these in order to make improvements.
Update 1
April 18 2025
Stryd responded fairly quickly and stated the following:
- Elevation data from the pods is not used when you record an activity with a Garmin watch.
- Stryd imports the activity and takes the elevation measurements from it, so it uses what my watch recorded.
- Stryd does not apply a correction algorithm to that imported data, at least not in this case.
- PowerCenter only displays the per-second elevation measurements from the activity file and aggregates them to show the total.
- They also referred me to this Garmin article – How do I Change the Elevation Source in Garmin Connect?
I know that my watch has a barometric altimeter and, indeed, when I open the activity in Garmin Connect, I can choose between ‘Your Device’ and ‘Professional Survey Data’ as the elevation source. I can now include both values in the table as well by splitting the Garmin row. For clarity, ‘Your Device’ refers to the watch’s barometer, while ‘Professional Survey Data’ uses GPS in combination with elevation maps.
| February 15 2025 | April 13 2025 | |
|---|---|---|
| Number of stair climb repetitions | 30 x | 59 x |
| Elevation gain according to Garmin (device) | 1,049 meters | 2,071 meters |
| Elevation gain according to Garmin (survey) | 919 meters | 1,851 meters |
| Elevation gain according to Stryd | 870 meters | 1,823 meters |
Now the question is: what is actually stored in an activity file (.fit file)? Let’s take a closer look. I use fitfileviewer.com to inspect the details of my activity from April. Under ‘Activities Metrics’, the ‘total ascent’ column shows an elevation gain of 2,071 metres. This is the value Garmin and Strava use for this activity, and it is also the closest to the reference value of 2,181.82 metres. So why doesn’t Stryd use this value as well? I honestly have no idea.

Okay, what other data do we have? The actual per-second data is stored in both ‘Record’ and ‘GPS Metadata’. Both series contain the field ‘enhanced altitude’. The first thing that stands out is that they start at different values, even though they have the same timestamp.
The second question is how elevation changes can be derived from this data. Does a positive difference from one row to the previous one count as ascent, and a negative difference as descent?
The third thing I notice is that the altitude recorded under ‘GPS Metadata’ does not change by the same amounts as the altitude under ‘Record’.

A plot showing both data series.

Especially when you zoom in, it becomes even clearer that the two series really are different. So which of the two should we use?

I wrote some C# code to analyse both series. To do this, download the ‘Record’ section (18,387 rows) and the ‘GPS Metadata’ section (18,424 rows) in ISO format. The code then calculates the sum of the elevation differences. Install the CsvHelper NuGet package as a dependency to run it.
using System.Globalization;
using CsvHelper.Configuration;

const string gpsMetadataFilePath = "/Users/dirk-janmeijer/Downloads/18816702726_ACTIVITY-gps_metadata.csv";
const string recordFilePath = "/Users/dirk-janmeijer/Downloads/18816702726_ACTIVITY-record.csv";
using var gpsMetaDataReader = new StreamReader(gpsMetadataFilePath);
using var recordDataReader = new StreamReader(recordFilePath);
var config = new CsvConfiguration(CultureInfo.InvariantCulture);
var usCultureInfo = new CultureInfo("en-US");
using var gpsMetadataCsv = new CsvHelper.CsvReader(gpsMetaDataReader, config);
using var recordCsv = new CsvHelper.CsvReader(recordDataReader, config);
var gpsMetadataItems = gpsMetadataCsv.GetRecords<dynamic>().ToArray();
var recordItems = recordCsv.GetRecords<dynamic>().ToArray();
var (gpsMetadataElevationGain, gpsMetadataElevationLoss) = GetElevation(gpsMetadataItems);
var (recordElevationGain, recordElevationLoss) = GetElevation(recordItems);

Console.WriteLine($"GPS Metadata: {gpsMetadataElevationGain.ToString("#,##0.00", usCultureInfo)} elevation gain, {gpsMetadataElevationLoss.ToString("#,##0.00", usCultureInfo)} elevation loss");
Console.WriteLine($"Record: {recordElevationGain.ToString("#,##0.00", usCultureInfo)} elevation gain, {recordElevationLoss.ToString("#,##0.00", usCultureInfo)} elevation loss");
return;

(decimal elevationGain, decimal elevationLoss) GetElevation(dynamic[] items)
{
    var elevationGain = new List<decimal>();
    var elevationLoss = new List<decimal>();
    foreach (var tuple in items.Zip(items.Skip(1)))
    {
        var firstEnhancedAltitude = GetEnhancedAltitude(tuple.First);
        var secondEnhancedAltitude = GetEnhancedAltitude(tuple.Second);
        var difference = Math.Abs(firstEnhancedAltitude - secondEnhancedAltitude);
        if (firstEnhancedAltitude > secondEnhancedAltitude)
        {
            elevationLoss.Add(difference);
        }
        else
        {
            elevationGain.Add(difference);
        }
    }

    return (elevationGain.Sum(), elevationLoss.Sum());

    decimal GetEnhancedAltitude(dynamic row) => decimal.Parse(row.enhanced_altitude);
}GPS Metadata: 3,662.20 elevation gain, 3,657.20 elevation loss
Record: 2,155.60 elevation gain, 2,151.20 elevation lossAs you can see, there is a very large difference between the two series. The points in ‘GPS Metadata’ show a lot of erratic variation, which means that too much ascent and descent is incorrectly being counted. But neither series results in the 1,823 metres reported by Stryd, or the 1,851 metres reported by Garmin (survey data).
At this point, it becomes quite unclear what Stryd means when they say that they “show the data directly from the activity file based on the per-second information”. Are there other data points in the activity file that I am overlooking? Is my analysis or the code wrong? I do not know.
Either Stryd is simply doing an elevation-map lookup, or they derive ascent and descent in a different way from the method I used in the code above. Possibly some form of filtering, smoothing, and hysteresis?
Update 2
April 19 2025
Okay, now it gets really interesting, because I just realised that the Stryd pods themselves also record activities, even when you record through Garmin. You can download these activities from the pods and sync them to your Stryd account. Because my activities had already been synced to my Stryd account through Garmin, this resulted in duplicate activities.
The interesting part is that I therefore also have the original Stryd data, which means I can actually answer the question of how reliable Stryd’s elevation data is. The Stryd footpods recorded only 1,641 metres of elevation gain during my activity in April! In reality, according to the AHN data, this should be somewhere around 2,181 metres. The Stryd pods measure elevation themselves using their built-in barometer.

Unfortunately, I no longer have the February activity from the Stryd pods themselves. I think I synced it at some point earlier and immediately removed the duplicate, so it was deleted. I can update the table once more, this time by splitting the Stryd row into the imported activity and the activity recorded by the Stryd pods themselves.
| February 15 2025 | April 13 2025 | |
|---|---|---|
| Number of stair climb repetitions | 30 x | 59 x |
| Elevation gain according to Garmin (device) | 1,049 meters | 2,071 meters |
| Elevation gain according to Garmin (survey) | 919 meters | 1,851 meters |
| Elevation gain according to Stryd, imported activity from Garmin | 870 meters | 1,823 meters |
| Elevation gain according to Stryd pods | 1,641 meters | |
| Elevation gain according to AHN4 | 1,109.4 meters | 2,181.82 meters |
Conclusion: During my activity in April, with 2,181 metres of elevation gain, the Stryd pods recorded only 1,641 metres. That means they were off by 24.8%!
For clarity: I find running with power interesting, because it makes it easier to maintain a consistent effort. You run slower into a headwind, in warm weather, high humidity, and uphill. You run a bit faster with a tailwind, in cooler conditions, lower humidity, and downhill. A power meter that combines all of this into a single metric, namely power, makes this very easy to understand.
I also think Stryd and the Stryd footpods are a good product. Apart from recurring connection issues, the pods look good, the race predictions are surprisingly accurate, and the reported power does indeed seem to match the effort you are putting in reasonably well.
For power to really work properly, however, the underlying values first need to be accurate. Temperature, humidity, air pressure, distance, etc. The fact that one of those values can simply be off by 20% is not okay. You need to be able to trust that the reported power is correct.
In addition, power should use a consistent scale so that you can compare it, both with yourself and with others. Otherwise, all it really tells you is: a higher number means more effort, and a lower number means less effort. And most people can already judge that quite well themselves.
Update 3
April 20 2025
The Stryd article mentioned above has been taken offline. I hope this means that a newer version will be published soon, explaining more precisely and clearly how Stryd actually handles elevation data.
Update 4
October 4 2026
My intention was to collect a lot of elevation data with the Stryd pods on 18 September during the 54 km Julian Alps Trail in Slovenia. With more than 2,700 metres of elevation gain on this trail, it seemed like a good test. But after the event, I found out that for some reason the Stryd pods had not recorded anything, unfortunately.
After a long time, I then checked the Stryd website again and found that a new article had appeared: Strava and Stryd. In it, I read:
Stryd uses 3-dimensional motion capture and changes in barometric pressure to determine pace, distance, and changes in elevation.
Stryd also explains that on hills it measures the hypotenuse of the triangle. That all sounds good, but unfortunately it still provides very few details.
Update 5
October 5 2026
Interesting! Apparently there is a Stryd patent application. It specifically states that:
- the current gradient can be estimated by combining time-correlated barometric pressure measurements with pace
- a linear gradient function can be fitted to this
- this reduces the influence of slow pressure changes caused by the weather
- the barometer signal can be filtered using a low-pass filter of around 0.2 Hz to suppress wind/aerodynamic pressure fluctuations
- the cutoff can be adjusted dynamically
- elevation change is then used directly in a power component
The power component looks as follows:
The patent explicitly states that the different k-factors can be determined empirically based on measurements from one or more users. They could, for example, be based on averages from a group of runners, but they could also be personalised for one specific runner. However, this raises two fundamental questions:
- What is your reference framework? Is it possible to determine an accurate ground truth for one person, or even for groups?
- And is this k-factor sufficient, or is the deviation more dynamic? Suppose the deviation depends on speed, gradient, cadence, etc. In that case, a fixed k-factor is only a rough correction and is insufficient to model it accurately.